Intermediate
Macroeconomics
Lecture 1
Douglas Hanley, University of Pittsburgh
What we'll learn
- History of thought: How have economists thought about the economy?
- What causes long-term economic growth?
- What causes short-term economic fluctuations, recessions, depressions?
- How to read the news?
What is macroeconomics?
- Distinction between micro and macro has been growing more and more blurry over the years
- Convergence in methods means that primary distinction is now in focus
- Generally, we're interested in how the economy is moving around in aggregate
- Distributions, such as that of wealth or income, are also a big part of macro
Useful Resources
- Data: FRED, Penn World Tables, Google Public Data
- Blogs: Marginal Revolution, Mankiw, Williamson, Krugman
- Twitter: @stlouisfed (and other Feds), @nberpubs, @BrookingsEcon, @Noahpinion
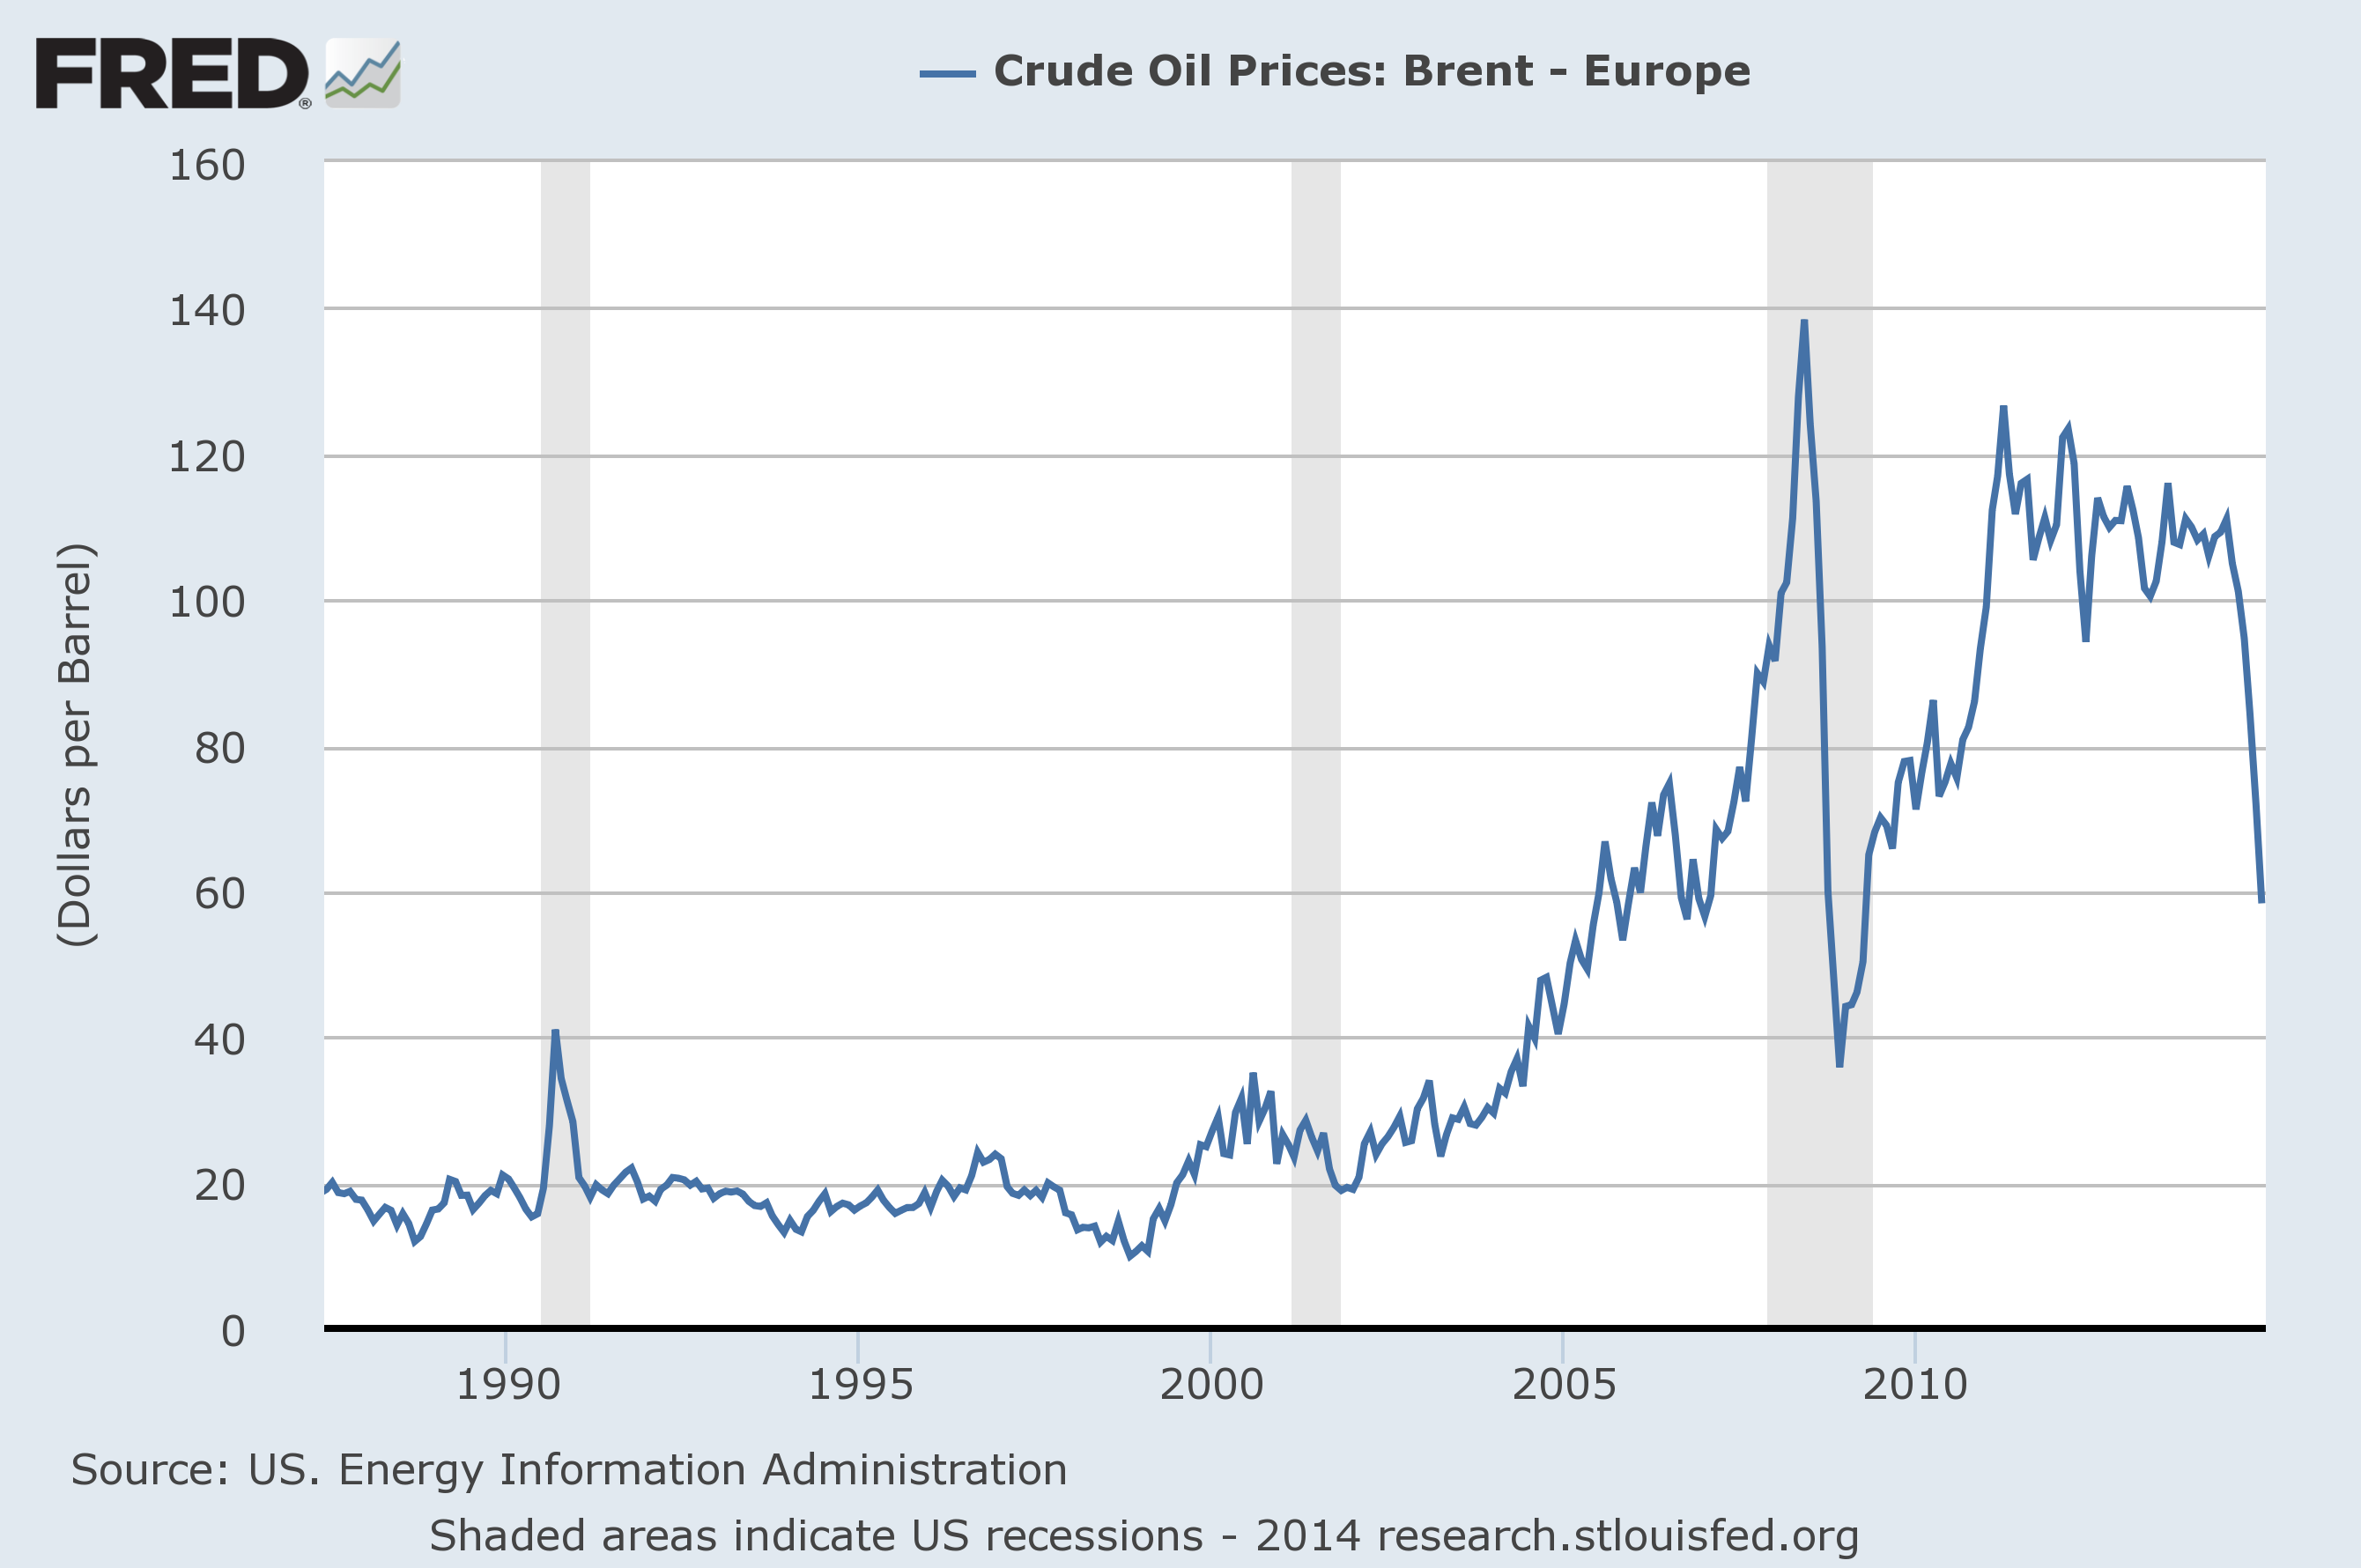
Fun with FRED
Empirical Approach
Who needs theory?

US Civilian Unemployment Rate (Monthly)
Some Econometrics
- These don't look like stock prices
- Random walk: monthly changes normal AND uncorrelated
- Unemployment series has former but not latter

More Econometrics
- Must be some mean reversion in here, $\varepsilon_t \sim \mathcal{N}(0,\sigma)$ $$u_{t+1} - u_t = - \rho (u_t-\bar{u}) + \varepsilon_t$$
- Running this regression yields $\rho=0.01$ and $\bar{u}=6.1\%$
- Still don't really capture the sudden increases during a recessions, $\rho$ is too small in attempt to compromise
Simulated Paths
- Need to introduce some notion of regime switching, expansion and recession periods
- Now $\bar{u}$ occasionally switches to say $\bar{u} = 15\%$ for a year or two then goes back to 6%

I'm Feeling Unsatisfied
- Such models provide a reasonably good fit of the data, but what do we really learn from them?
- As a purely intellectual pursuit, we seek a deeper understanding of causes ("storytelling")
- Also cannot answer important questions ("counterfactuals")
- What is the effect of a minimum wage on unemployment?
- Can unemployment insurance help smooth these fluctuations?
Models Are Not Magic
- Any time we write down a fully specified model, we are constraining the set of possibly answers. Sometime we are even assuming the answer
- Answering questions of causality always requires careful econometrics
- Unemployment insurance: only used during bad times, naive regression would show negative effect on employment
Models Can Be Useful
- If we are confident in our assumptions, models are useful
- Quantifying the impact of external changes
- Tax system changes
- Opening of trade
- Advancements in technology
- By specifying utility functions for agents in the economy, we can also evaluate the welfare implications of various policy changes
What Will We Cover?
Trend vs. Cycle
Generally we will make the distinction between short-term economic fluctuations and long-term economic growth

Behold the HP Filter
- Hodrick-Prescott (HP) filter: common tool to separate these
- Different smoothing factors divide trend and cycle in different ways, no "right" answer

Other Smoothing Methods
- Other methods include frequency decomposition (Fourier transform, Low-pass filter) or moving average smoothing.

Long-term growth
- What drives productivity growth over time?
- Innovation, R&D, Basic Science, Startups
- Why do certain countries growth faster than others?
- Cross-country studies
- Up to but not including development economics
- How can government policies affect these processes?
Short-term Fluctuations
- Here we are primarily concerned with the comovement of various aggregates such as GDP, consumption, investment, and unemployment, hours worked
- Anatomy of a recession/expansion: which way do these various series co-move?
- What is the fundamental driving force behind economic fluctuations? This is (still) a topic of hot debate
- What mechanisms might amplify these fundamental forces? Financial constraints, price rigidity, labor market frictions
Distribution of Wealth
- The focus on distributional concerns has been relatively recent in its intensity (you've all heard of Piketty?)
- Touches on enduring questions about how the spectacular gains from technological advancement in the 20th century have been shared
- Theoretical simplicity tends to drive us away from such concerns: "representative agent" framework
Mean vs. Median
Last few decades look quite different

International Perspectives
- Macroeconomics has a strong focus on US phenomena
- Historically better available data
- Most prominent macroeconomists from (or residing in) US
- Looking across countries introduces potentially unobservable confounding factors
- But this leaves us with only ~200 data points for quarterly series
Cross-country Comparisons
Historical GDP data from Angus Maddison

Theoretical Tools
- How can we model the entire economy in a simple way?
- What sorts of assumptions are generally made?
- How does one solve a model?
- What predictions are generated by the model and how can we evaluate them?
Empirical Methods
- Measurement of aggregates such as GDP, unemployment
- "Stylized facts" about modern economies
- Historical trends, the development process
- Quantitative results from notable studies
Quantitative Methods
- Working with data, computation, estimation
- These are skills that are increasingly valued and utilized in the economics profession
- Even if you don't become economists, they're still very useful
- You can answer questions using models like
- What is the effect of ICT on economic growth?
- How do demographic transitions affect savings rates?
- Can oil price shocks account for large economic fluctuations?
Readings and Assignments
- No "official" course text book -- everything is in these slides
- Occasional reading assignments in the form of papers or reports
- Five biweekly homework assignments (30% of grade)
- Short answer
- Proofs/derivations
- Data and empirical work
- One end-of-term empirical project/assignment (10%)
Exams
- There will be two midterms and one final exam, each worth 20%
- Coverage based entirely on material covered in lectures as assignments, all are non-cumulative
- Will require deep understanding of ideas presented in class, not just definitions and memorization
What You Should Know
- Basic mathematics and calculus are pretty important in macroeconomics
- Mostly derivatives, not many integrals
- Might want to refresh your memory if you don't know $\frac{d\log(x)}{dx}$ off the top of your head
- Statistics, probability, and regressions
Economic Measurement
GDP Measurement
- GDP tracks economic activity, not necessarily whether this activity is useful for individuals or society
- Main task is to avoid double counting. Don't want a "middleman" artificially inflating GDP
- Three theoretically equivalent methods
- Production approach
- Expenditure approach
- Income approach
Very Simple Example Economy
- Apple Economy
- Farmers produce apples
- Restaurant makes apple pie
- Consumers enjoy apples/pie and extend loan to farmers
- Government collects taxes from all three
Apple Farmers
Balance sheet summary
$$\begin{array}{ll} + & \text{Revenue } (\$20) \\ - & \text{Wages } (\$5) \\ - & \text{Interest } (\$0.5) \\ - & \text{Taxes } (\$1.5) \\ \hline = & \text{Profit } (\$13) \end{array}$$Restauranteurs
Balance sheet summary
$$\begin{array}{ll} + & \text{Revenue } (\$30) \\ - & \text{Apples } (\$12) \\ - & \text{Wages } (\$4) \\ - & \text{Taxes } (\$3) \\ \hline = & \text{Profit } (\$11) \end{array}$$Consumers
Balance sheet summary
$$\begin{array}{ll} + & \text{Wages } (\$14.5) \\ + & \text{Interest } (\$0.5) \\ + & \text{Profits } (\$24) \\ - & \text{Taxes } (\$1) \\ \hline = & \text{Consumption } (\$38) \end{array}$$Government
Balance sheet summary
$$\begin{array}{ll} + & \text{Taxes } (\$5.5) \\ - & \text{Wages } (\$5.5) \\ \hline = & \text{Deficit } (\$0) \end{array}$$Production Approach
- Also called the value-added approach
- Start with raw materials and work way up the value chain
- iPhone consists of: metals/petroleum (World) + chip/screen production (Taiwan/Japan/Korea) + assembly (China) + design/software (USA) + shipment (?) + retail (USA/World)
- Government value added simply based on tax revenues
Production Approach
For private entities, value added is simply profit. So in our example economy, adding up value added yields
$$\begin{array}{ll} + & \text{Farmers } (\$20) \\ + & \text{Restaurant } (\$18) \\ + & \text{Government } (\$5.5) \\ \hline = & \text{GDP } (\$43.5) \end{array}$$Expenditure Approach
- Here we look at what consumers are actually spending and saving, adjusting for net exports $$GDP = C + I + G + NX$$
- Consumption (C): goods, services, and durables
- Investment (I): machinery, structures, research, education
- Government (G): any government expenditures
- Net exports (NX): exports - imports
Expenditure Approach
In our example economy, we get $$\begin{array}{ll} + & \text{Consumption } (\$38) \\ + & \text{Investment } (\$0) \\ + & \text{Government } (\$5.5) \\ + & \text{Net Exports } (\$0) \\ \hline = & \text{GDP } (\$43.5) \end{array}$$Income Approach
- This tracks how much consumers are earning
- Primarily labor wages/salaries and capital income (dividends, stock returns, interest)
- In our example $$\begin{array}{ll} + & \text{Wages } (\$14.5) \\ + & \text{Profits } (\$24) \\ + & \text{Interest } (\$0.5) \\ - & \text{Taxes } (\$4.5) \\ \hline = & \text{GDP } (\$43.5) \end{array}$$
The Real World
- If we go through and measure these three, they often come out different, sometimes substantially so
- The GDP figures you usually see cited are the expenditure type, though the income type is also widely reported (GDI)
- NIPA also creates certain synthetic goods such as "housing services", which owner occupied households supply to themselves (imputed from comparable rental market)
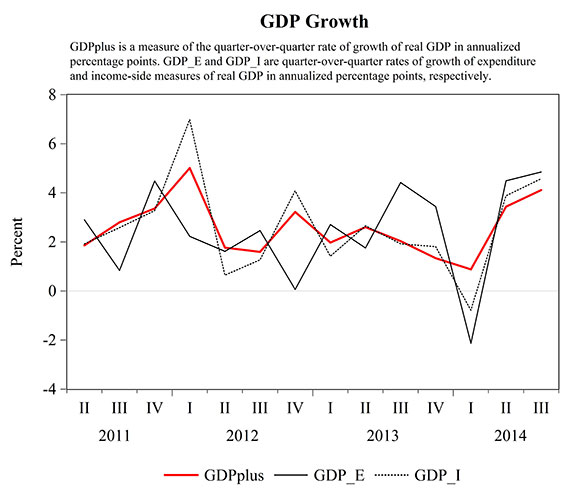
A Synthesized Approach
Some have proposed using a combination of both expenditure and investment measures, rather than one or the other
What are we missing in GDP?
- Black/gray market economies (Colorado had 6% GDP growth in 2014), legal non-market activities (home production, informal industry)
- Efficiency of economic activities (some externalities, misallocation), health, life expectancy, distributional concerns
- Leisure time not accounted for. Like housing, could have people pay themselves synthetic wages for leisure time
Beyond GDP
- A recent paper by Chad Jones and Pete Klenow tries to incorporate all of these concerns: Beyond GDP? Welfare across Countries and Time
- They include cross-country differences in
- Life expectancy
- Consumption levels and inequality (Rawlsian veil)
- Leisure levels and inequality
- They find that though GDP is a good predictor of overall welfare, it is "off" on average by about 35%
Nominal vs. Real
- One issue: if prices go up, so does GDP
- What if all prices and wages doubled overnight?
- We need to normalize to account for inflation
- This is done using the consumer price index (CPI)
- Nominal means using monetary figures directly, while real means after adjusting for inflation
Let's Look at Real GDP

Calculating the CPI
- In practice, the Bureau of Economic Analysis (BEA) sends people out to check the prices of various products
- By using year 2000 prices to value 2010 production, we can get an idea of the 2010 GDP in 2000 dollars
- Doing the reverse will not give the same answer though!
- Chain-weighting: define the inflation rate as the "average" of two directions $$g = \sqrt{g_1 \cdot g_2}$$
Issues with CPI
- One issue with CPI is the accounting for new products
- BEA uses a "basket" of common goods to represent production, but the basket of goods that consumers buy has changed radically over time
- What is the price of a smartphone in 1980? This is a difficult question to answer
(Un)employment Rates
- Usual quoted number is unemployment rate $$\text{Unemployment} = \frac{\text{# people looking for jobs}}{\text{# people looking or working}}$$
- Underemployment: people working part-time who would rather be full-time or in jobs they are overqualified for
- Labor force participation rate $$\text{LFPR} = \frac{\text{# of people looking or working}}{\text{working age population}}$$
Time Series Description
- Up until now we've been describing the economy at a given point in time
- Also need to describe how these are moving over time
- Let $x_t$ be a given data series (such as GDP or unemploy)
- Rate of change: $x_{t+1}-x_t$
- Growth rate: $g_t = \frac{x_{t+1}-x_t}{x_t} \approx \log(x_{t+1})-\log(x_t)$ (derive)
Time Series Persistence
- We need to define some terminology to talk precisely about time series data
- Persistence: if growth is high today, will it be high tomorrow? $$Cor(x_t,x_{t+1}) = \mathbb{E}\left[(x_t-\bar{x})(x_{t+1}-\bar{x})\right]$$
- $\mathbb{E}$ is the expected value or average operator and $\bar{x} = \mathbb{E}[x_t]$ is the long term average
- Economic indicators are generally persistent in the short and medium term, but not in the long term
Time Series Volatility
- How much does a particular series fluctuate?
- Volatility: standard deviation of growth rate over time $$[Std(x_t)]^2 = Var(x_t) = \mathbb{E}\left[(x_t-\bar{x})^2\right]$$
- Can define a scale invariant coefficient of variation $$\frac{Std(x_t)}{\bar{x_t}} = \sqrt{\mathbb{E}\left[\left(\frac{x_t-\bar{x}}{\bar{x}}\right)^2\right]}$$
Time Series Correlations
- Do two series tend to move together over time?
- Comovement: covariance of two growth rates over time $$Cov(x_t,y_t) = \mathbb{E}\left[(x_t-\bar{x})\cdot(y_t-\bar{y})\right]$$
- Normalizing this yields Pearson's coefficient in $[-1,1]$ $$\rho_{x,y} = \frac{Cov(x_t,y_t)}{\sqrt{Var(x_t) \cdot Var(y_t)}} = \frac{\mathbb{E}\left[(x_t-\bar{x})\cdot(y_t-\bar{y})\right]}{\sqrt{\mathbb{E}[(x_t-\bar{x})^2] \cdot \mathbb{E}[(y_t-\bar{y})^2]}}$$
Long-term Relationships
- Correlation between series: positive, negative, or neutral
- Contemporaneous correlation: $x_t$ is correlated with $y_t$
- It might be that $x_{t-1}$ is correlated with $y_t$: we say that $x$ is a leading indicated of $y$
- Can also have a "lagging indicator"
Business Cycle Regularities
- "Business cycle" is a term used to describe ups and downs in economic output growth
- There are certain common trends observed over time about how GDP and other series move $$\begin{array}{lcc} \textbf{Series} & \textbf{Correlation} & \textbf{Volatility} \\ \hline \text{Consumption} & 0.78 & 0.77 \\ \text{Investment} & 0.85 & 4.90 \\ \text{Employment} & 0.80 & 0.63 \\ \text{Labor Prod.} & 0.80 & 0.62 \end{array}$$
Discussion and Caveats
- Term "business cycle" is misleading: no sense in which many good years means we are "due" for a bad year (gambler's fallacy)
- These things really are quite hard to predict in the medium and short term
- Targeting the regularities discussed here is one way to evaluate the performance of a macroeconomic model
- Of course, there can be many models that fit these facts, so we may have to bring in even more data
Empirical Training
Working With Data
- I want to get you comfortable working with data by end of semester (and hopefully long before!)
- There are myriad different tools out there to choose from
- Spreadsheet - Excel, Google Docs, etc (very limited)
- Stata - great for pure stats (free at Pitt, $$$ in real world)
- Matlab/Mathematica - better for more intense computation (free/$$$)
- Python - general purpose and free everywhere
Getting The Tools
- You can run Python on your own computer: Anaconda
- Or you can run a hosted version at: wakari.io
- Stata, Matlab, and Mathematica can be downloaded from Pitt: Software Download Service
Using The Tools
- We're going to start doing data work on the first homework, so get everything set up right away!
- Ask your me or your TAs if you have any issues