Intermediate
Macroeconomics
Lecture 5
Douglas Hanley, University of PittsburghEndogenous Growth
In This Lecture
- How does the Solow model perform across countries?
- Does it match the data we see historically?
- Is there some way that we could improve it?
- Yes! We can add human capital accumulation (education)
Solow Predictions
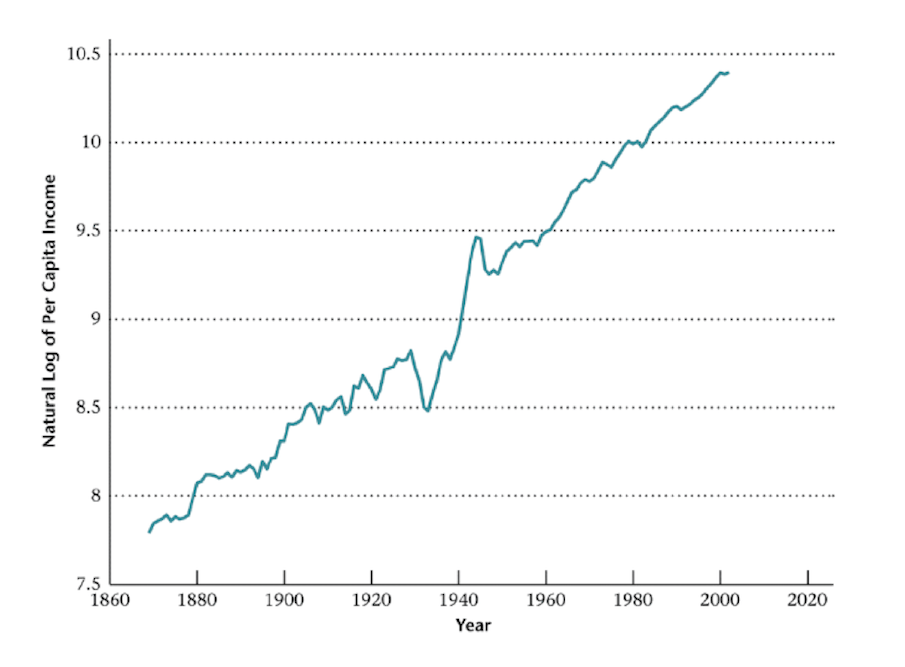
First, the Solow model predicts that we can have sustained income growth with technological growth (✓)
Solow Predictions
Second, it predicts a positive relationship between investment rate (savings) and income per worker (✓)

Solow Predictions
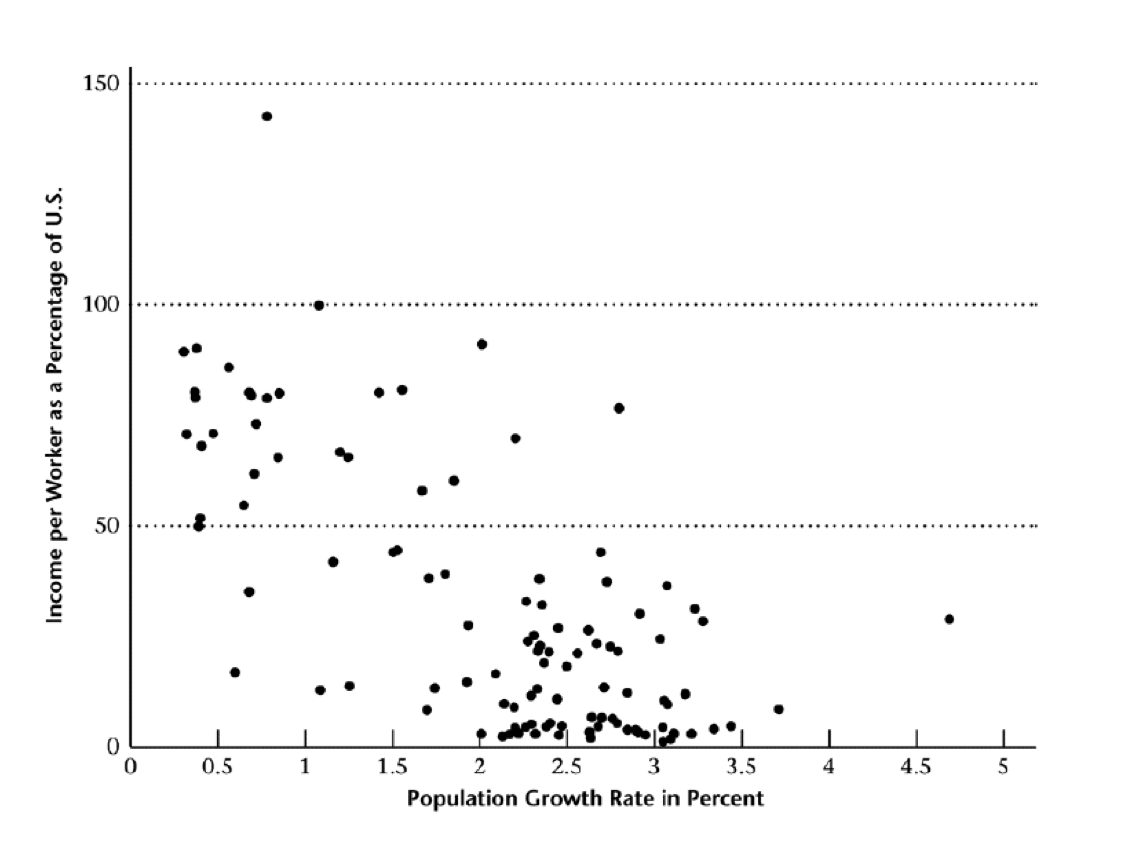
Third, it predicts that countries with higher population growth will have lower income per worker (✓)
Solow Predictions
Fourth, it predicts that countries will convergence towards common steady state income level (✓)
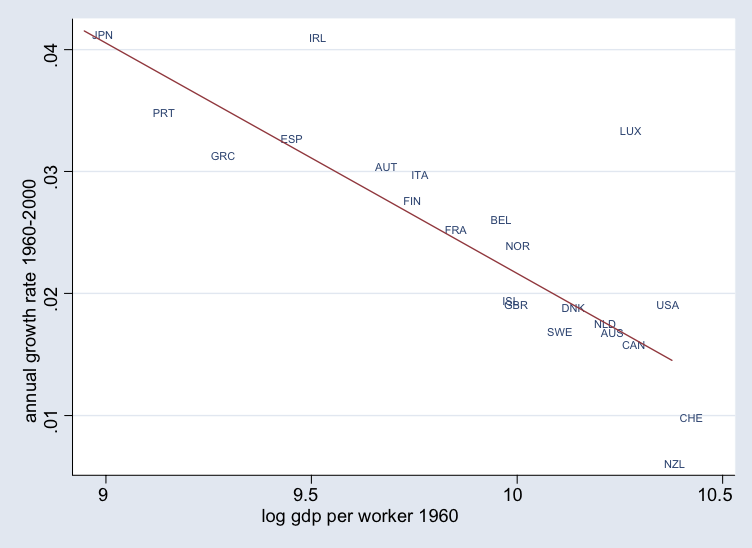
Convergence of Outcomes
But I kind of cheated on the last graph, which only includes "core" OECD countries
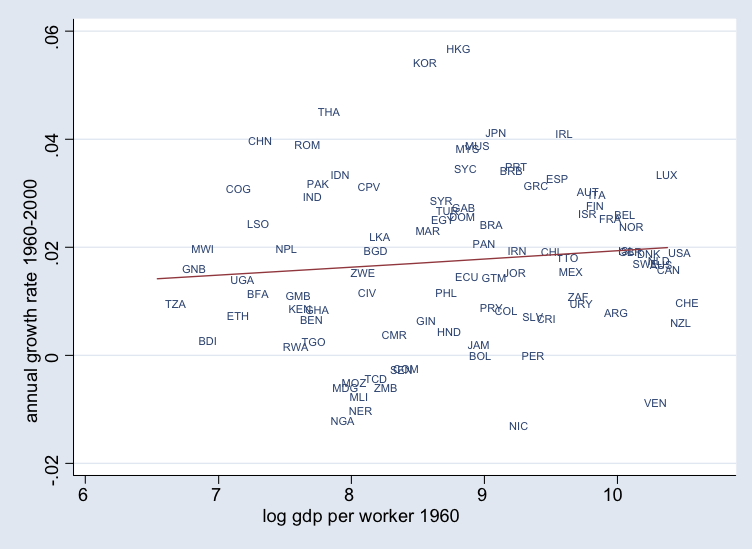
Club Convergence
So Solow correctly predicts convergence for the rich "club" of countries, but fails otherwise (✗)

Separate Steady States
- Our assumption was of course that the countries have identical parameters
- It could be that different countries have different values for TDP ($z$)
- In this case different groups would converge to different steady states
Solow With TDP Differences
Here we have rich, middle, and poor countries: $z_r \gt z_m \gt z_p$

Differences in TFP
- What forces can lead to such differences in productivity?
- Inability to adopt or inapplicability of foreign technology (geography, population density, policy)
- Misallocation of people or resources: market failures (monopoly, externalities), discrimination, etc
- Hsieh, Hurst, Jones, and Klenow argue that 17-20% of GDP growth since 1960 comes from improved labor allocation
- Failure of political or legal institutions
Intro Endogenous Growth
- Solow model is an exogenous growth model: does not take a stance on where differences in TFP ($z$) come from
- We want to introduce an endogenous growth model to explain these differences
- To do this, we will look at the accumulation of human capital
- Human capital differs from physical capital because it is nonrival: (thankfully) I can teach you guy without having to forget the material myself
Building Blocks of the Model
- There is a representative consumer who chooses to study a certain fraction $(1-u)$ of their time
- Letting the human capital level be $H_s$, this leads to the accumulation equation $$H_s^{\prime} = b(1-u)H_s$$
- The parameter $b$ captures the efficiency of human capital accumulation (quality of schools perhaps)
Production Side
- There is also a firm that hires workers and whose output is proportional to the total amount of human capital employed $$Y = z u H_d$$
- Notice that workers are only working a fraction $u$ of the time (they study the rest of the time)
- As before, $z$ is the overall productivity of the production process
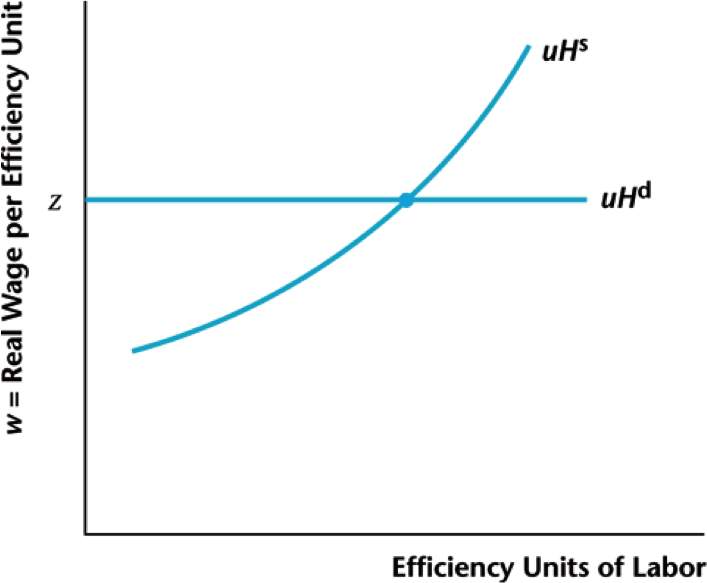
Profit Maximization of the Firm
- A firm pays a wage $w$ per human capital, so skilled workers get paid more
- The profits of the firm are then $$\pi = z u H_d - w u H_d = (z-w) u H_d$$
- If $w \gt z$, the firm would want to produce $\infty$
If $w \lt z$, the firm would produce nothing
$\rightarrow$ In equilibrium we must have $w = z$
Equilibrium Wage
You could imagine the consumer choosing $u$ in response to the wage $w$, but we know that $w=z$, so we take $u$ as given
Putting It All Together
- Consumers only make income from wages, meaning $$C = w u H^s = z u H$$
- Human capital will be growth at a constant rate over time $$\frac{H^{\prime}-H}{H} = b (1-u) - 1$$
- Meaning while consumption will grow at the same rate $$\frac{C^{\prime}-C}{C} = \frac{H^{\prime}-H}{H} = b (1-u) - 1$$
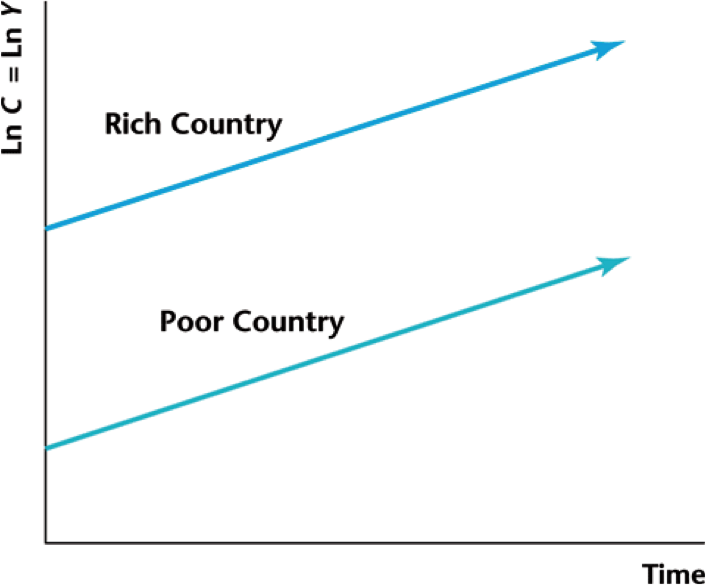
Do We Have Convergence
There is no force pushing countries to a common income level
Effect of Policy
- The fraction of time spent studying $1-u$ acts like a savings rate, but with time instead of money
- Decreasing $u$ (more studying) decreases current consumption but increases growth rate
- Higher $b$ (more efficient schooling) also increases growth rate
- Unlike Solow model, growth rate is not a function of current level of output
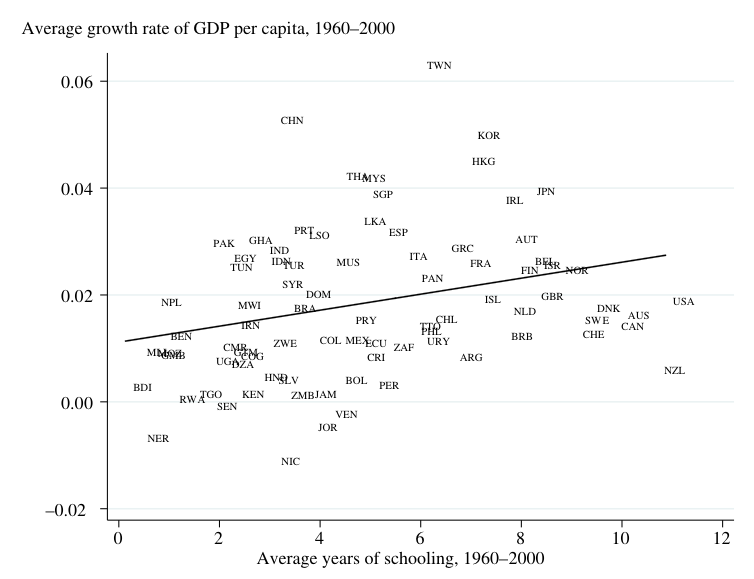
Empirical Validation
- So how well does this match the data?
- We can run a regression of GDP growth on years of education $$\log\left(\frac{Y_{i,t+1}}{Y_{i,t}}\right) = \beta_0 + \beta_1 S_{i,t} + \beta_2 X_{i,t} + \varepsilon_{i,t}$$
- Here $Y_{i,t}$ is GDP in country $i$ at time $t$, $S_{i,t}$ is years of schooling, and $X_{i,t}$ is other control variables
- Bils and Klenow (2000) find that $\beta_1 = 0.003$, i.e., one more year of school leads to $0.3\%$ high growth per year
Side Note On Logarithms
- We often see people using logarithms instead of percentages $$\log\left(\frac{Y_{t+1}}{Y_t}\right) \quad \text{vs} \quad \frac{Y_{t+1}-Y_t}{Y_t}$$
- For any function $f$ we can define a Taylor expansion $$f(x) \approx f(x_0) + f^{\prime}(x_0)(x-x_0)$$
- When $f(x) = \log(1+x)$ and $x_0 = 0$ we find $$\log(1+x) \approx \log(1+0) + \frac{1}{1+0}\cdot(x-0) = x$$
Relationship Between Schooling and Growth
Interpreting Results
- This can't be taken directly as evidence of causality
- There are three, possibly overlapping, possible explanations
- Schooling leads directly to economic growth
- People, anticipating strong growth, choose to get more schooling
- Some third factor (such as effective rule of law) causes both
- Previous authors find that 1 accounts for about $30\%$ of relationship (2 might go the other way)
Underlying Causes of Growth
- This quickly leads to the question: why do some countries have more/better education than others?
- And now we're back to the basic questions of what causes differential economic outcomes
Relative Technology Levels
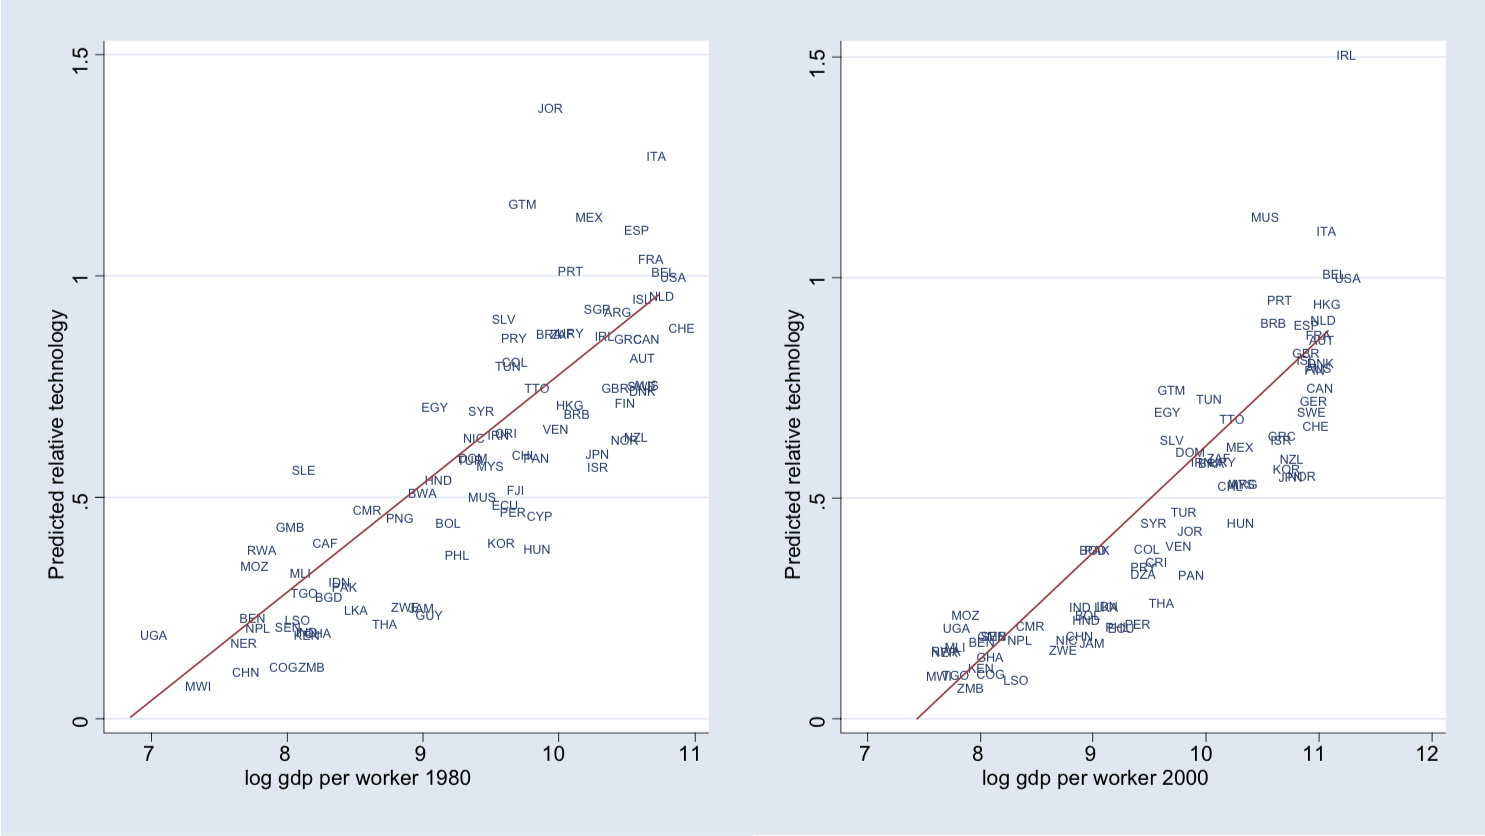
Technology Heterogeneity
- Previous plots show ratio of country's Solow residual to that of the US
- Countries below the red line have relatively low overall productivity, but make up for it with high levels of capital (physical or human)
- Noticeable clustering going from 1980 to 2000
Explanations for Growth
- There are four basic categories of fundamental explanations for differences (Acemoglu, 2007)
- The luck hypothesis
- The geography hypothesis
- The culture hypothesis
- The institutions hypothesis
Luck and Multiple Equilibria
- Pure, blind, dumb luck would be a depressing explanation, and we can't say much about that
- Multiple equilibria can arise from economies of scale in production
- Increasing marginal product means that if other people invest, it is better for me to invest too
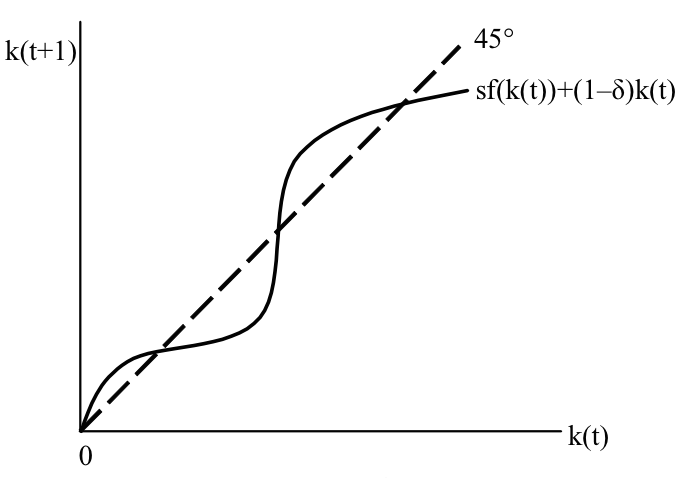
Multiple Equilibria in Solow
Three stationary points for capital! Only first and third are stable (robust to small perturbations)
Classic Coordination Game
This can also be framed in terms of a discrete choice model

Coordination Failure
- The high investment equilibrium is better for both people, i.e., it is Pareto optimal
- But if other people aren't investing, it is optimal for you not to invest as well $\rightarrow$ society can get stuck in bad equilibrium
- For poor countries simply switch to the high growth equilibrium? Seems implausible, such "shock therapy" hasn't worked well in past
Path Dependence
- Growth is a cumulative process over time, can we pinpoint the precise point when US and Indonesia (say) diverged?
- It could be that at some point there were two paths (high growth and low growth) and one was chosen
- Having gone along this path, one cannot easily switch to the other today
- This is called path dependence and is distinct from a coordination failure
Transitioning Between Paths
- How then have countries had growth "miracles" in Korea, Singapore, and others, where they seem to transition from one path to another?
- Why did China transition to a high growth regime in the late 70's? Could this be called luck?
- This naturally turns attention back towards changes in "institutions, policies, and culture"
Effects of Geography
- Geography affects the types of agriculture that are productive in certain areas, less so industry
- The development of agriculture historically may have affected the political and organizational institutions that formed, and hence long-term growth (Guns, Germs and Steel)
- Disease: Jeffrey Sachs and others estimate that malaria reduces growth rate of sub-Saharan African countries by $2.6\%$ annually
Effect of Institutions
- What are institutions? North (1990, p.3) says:
- Institutions include political decision-making mechanisms, enacted laws, cultural norms, etc.
- Importantly, they are decided by humans, not the inevitable byproduct of exogenous forces such as geography
“Institutions are the rules of the game in a society or, more formally, are the humanely devised constraints that shape human interaction.”
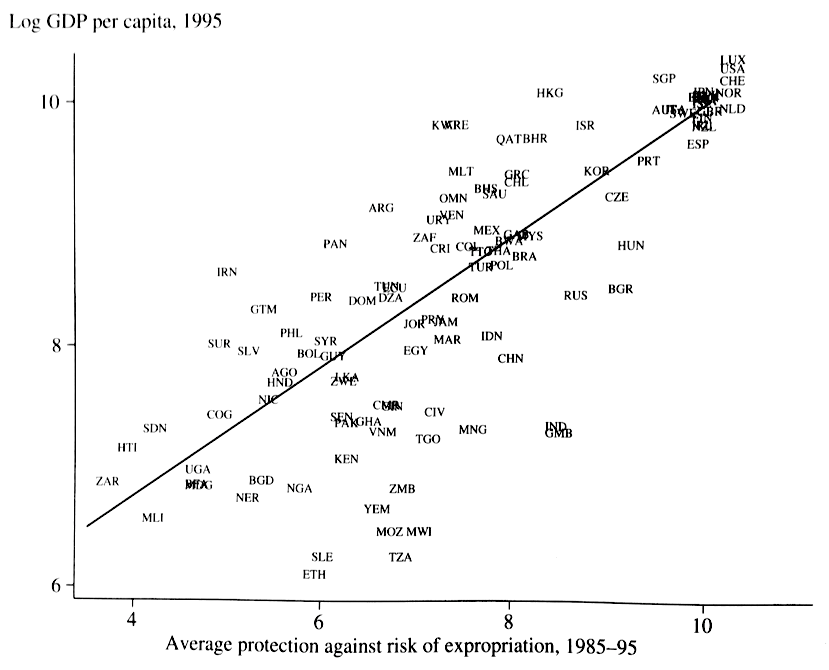
Institutional Trends
Institutions correlate with present day GDP
Institutional Development
- We often take institutions (laws, market structure, etc.) as given in economic models
- Some institutions are not obvious or are difficult to implement (patents for example)
- It is interesting to consider how different institutions might arise endogenously
- This will have implications for the differential development of nations and regions
Effects of Institutions
Endogenous institutions are hard to study
What if one factor causes both "good" institutions and growth?

Geographic Trends
Could something like latitude affect both institutions and growth?

Disentangling Effects
To really see the effect of institutions, we need something that effects them but not economic outcomes directly

Looking to the Data
- One such mechanisms is different colonial policies that administered in different countries
- We'll look at two possible factors that could affect these policies this but not present day growth (directly)
- Population density in 1500
- Disease mortality amongst settlers
Effect on Past Institutions
Population density in 1500 strongly related to legal institutions!

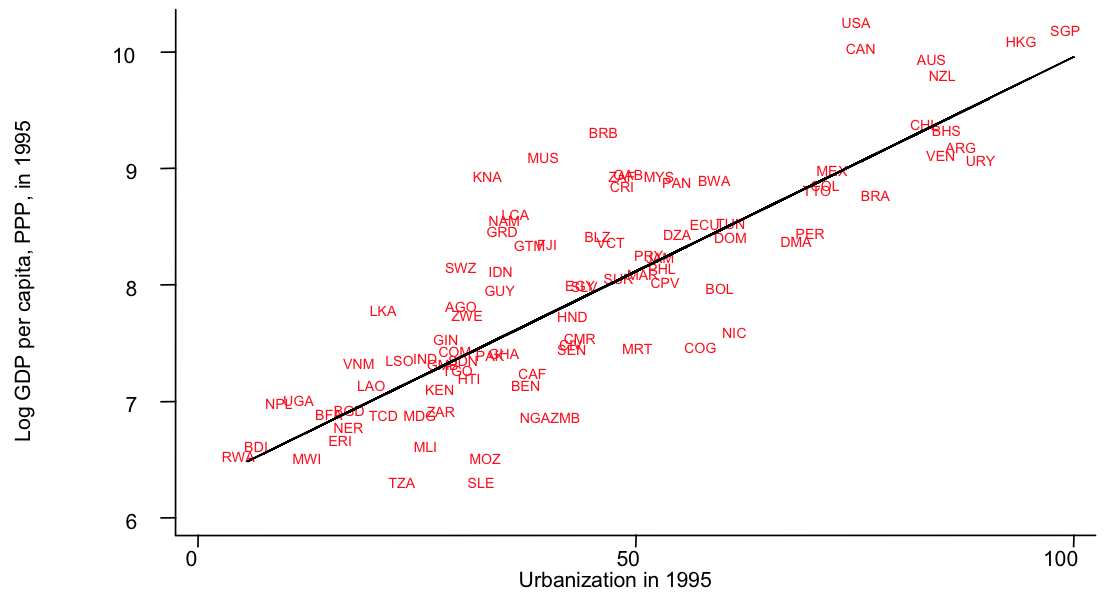
Urbanization and GDP
There is a clear relation between current urbanization (similar to density) and GDP
Reversal of Fortunes
We would expect countries that were dense then to have high GDP because density is highly persistent, but:

Institutional Legacy
- One very plausible explanation: high density countries got bad colonial institutions
- These persisted as bad present day institutions and caused lower GDP today
- We can tell the same story with settler mortality in colonies
- Acemoglu and Robinson lay out a detailed case in recent book Why Nations Fail
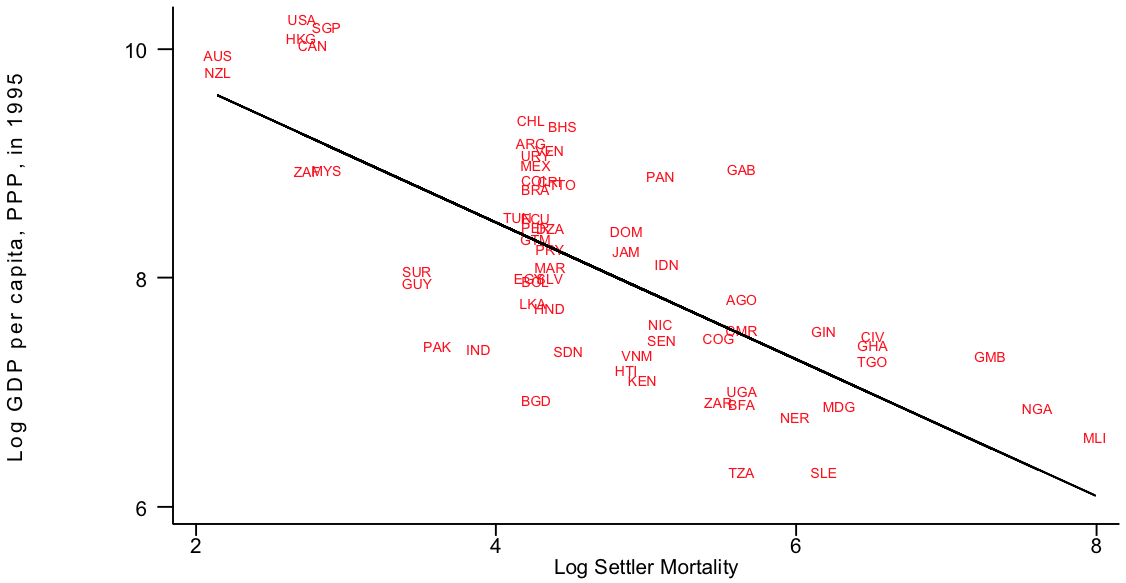
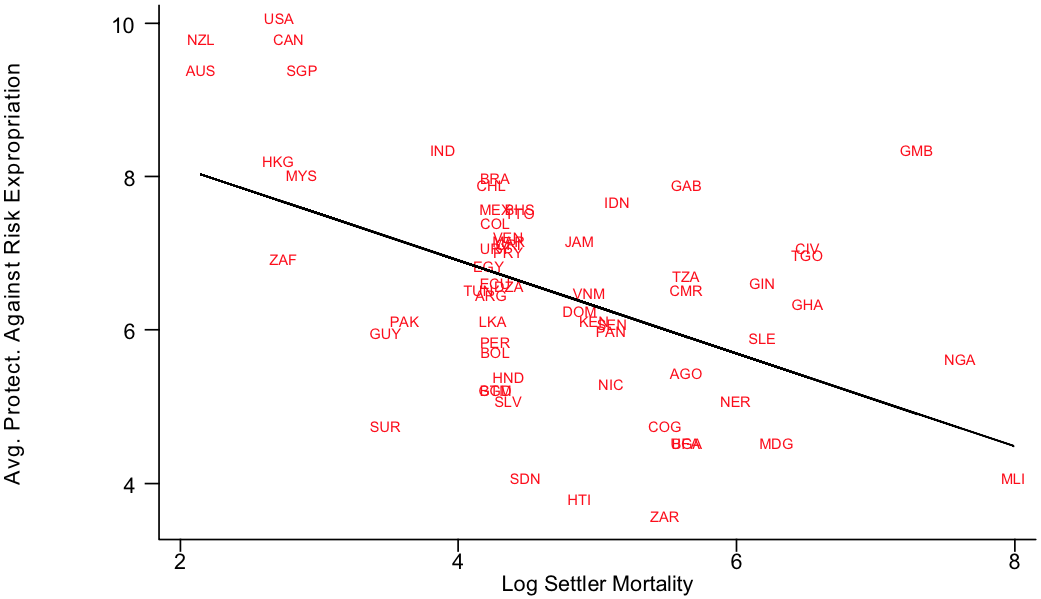
Settler Mortality
High settler mortality results in less property rights protection
Effect on Present Day GDP
Today we see the effect in institutions and resulting GDP